
Pricing your
property
The Goldilocks Effect!
Not Too High, Not Too Low, JUST RIGHT!
Your property's advertised price does not define the value of your home, the sales process will help guide you on this. Your advertised price is one element of a larger process designed to attract attention, foster interest, and entice buyers.
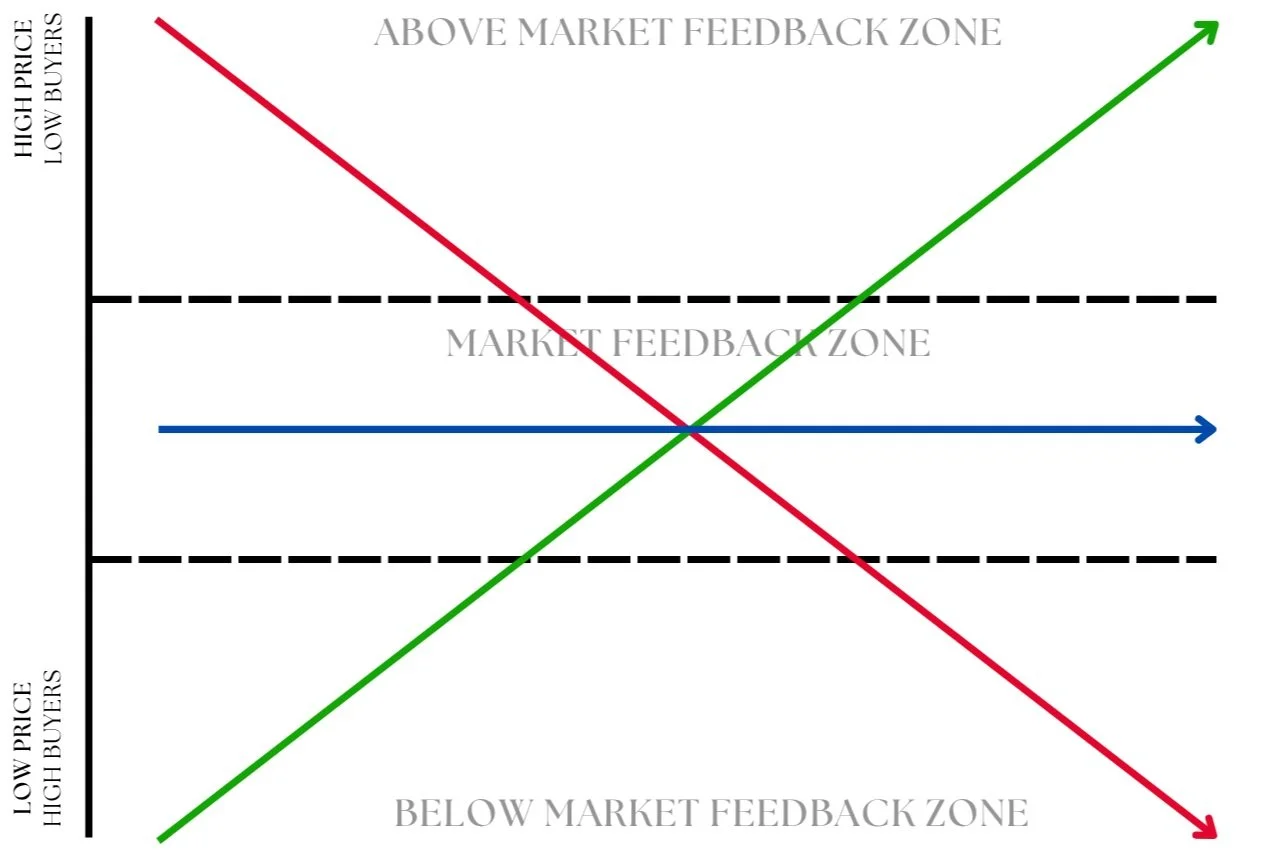
If the property is advertised with too high a price, buyers will not engage with the property, and if we price it too low, buyers will engage with the property but the clarity of absolute value will be lost with good offers likely to be seen as great offers.
As your agent, I constantly gather price feedback, assess data from our advertisements, and analyse the offers received so that I can effectively advise whether we should increase, decrease or hold firm on price expectations and if we are at the pointy end of potential price.
-
Advertising the price above where the majority of the market will see the value of the property sitting and negotiating down on price with buyers. This strategy brings less activity with buyers dismissing the property before inspecting. Conversations are negatively oriented as they focus on mitigating the discounts buyers seek for the property. i.e Selling a car second-hand.
-
Advertising the price at fair market value will see you receive market-level interest and market-level offers for the property. Half the interested buyers will seek to negotiate on price, and the other half will offer the asking price.
-
Advertising the price below market value creates excitement and an increased level of activity in the marketplace. More buyers see value in the property and form deeper connections.... these actions lead to competition and positive discussions, which drives the price back beyond market feedback. It also increases the social proof buyers are looking for and encourages strong increases due to the fear of missing out.
bUYER cURVE
At the core of every sales campaign, the focus is to attract attention and create interest. My job, as your agent, is to convert that interest into offers.
While we only need one buyer to sell a home, the pressures applied directly and indirectly when we have multiple interested buyers helps to drive the price upwards. As demonstrated by the bell curve below, minor adjustments to an advertised price will encourage larger percentages of buyers to engage with the property.
Example: If 1000 buyers are looking for a home in a suburb between $1.50 million & $1.65 million, an advertised price of $1.575 million would attract the interest of 500 buyers... if you were to change the advertised price to $1.60 million, the buyer pool would drop down to 157 buyer.
For a difference of $25,000 you would expose the property to 3x the amount of buyers... the reality is that this additional exposure will naturally carry the price back beyond the higher advertised price, as your agent I can additionally influence price & competition.
